Open Source Repository Browser
This page explains what the Open Source Repository Browser is, where the data comes from, and how to use the main parts of the dashboard. This is my most recent project and it is a work in progress!
What it is
The Open Source Repository Browser is an interactive dashboard for exploring open source software on GitHub that is connected to universities and research organizations. You can slice the collection by institution, technology, and impact metrics, drill into individual repositories, and compare patterns across the ecosystem.
The goal is simple: make it easier to see how open source from academic and affiliated communities is distributed, how projects are maintained, and where sustainability and security practices show up, without digging through GitHub one repo at a time.
Where the data comes from
Discovery on GitHub
The underlying dataset is built from GitHub. Repositories are collected by scraping and querying GitHub for users, organizations, and repositories that match a curated set of institutions and naming patterns. Using regular expressions, I matched university names and acronyms against GitHub entities (users, organizations, and repositories) to find candidate projects tied to those institutions.
Current Data
The current dataset for this dashboard is scoped to the universities and institutions represented in CURIOSS, a community for individuals who work in university and research institution OSPOs (see the current CURIOSS members list).
Affiliation and project type (AI-assisted)
Not every match is a clean institutional link. To estimate how strongly a repository is affiliated with a given university, I use large language models from OpenAI—specifically GPT‑5–family models—to score affiliation using:
Repository README and description; Contributor and profile-related signals where available.
You’ll see these as affiliation probabilities and project type labels in the app (for example, development tooling vs. other categories). They are predictions, not ground truth—use them as guidance alongside the raw metadata.
For more information on the data collection and classification, check my arxiv paper: Recipe for Discovery: A Pipeline for Institutional Open Source Activity.
What I filter out (for a clearer, faster app)
To keep the dataset focused and the application responsive, I exclude several kinds of repositories:
Archived repositories, forks, repository templates, and, for now, repositories with zero stars (so the browser concentrates on projects that have attracted at least minimal attention).
These choices are applied when building the data; the live dashboard reflects this pre-filtered collection.
Security scores (OpenSSF Scorecard)
I also run OpenSSF Scorecard checks against projects to bring in security-related metrics (for example branch protection, CI, signed releases, and an overall score). Coverage is still incomplete—only a subset of repositories currently has scorecard results. Filling this in for the full dataset is ongoing work, and the Security views will become more complete as that pipeline finishes.
Using the dashboard
Sidebar: filters
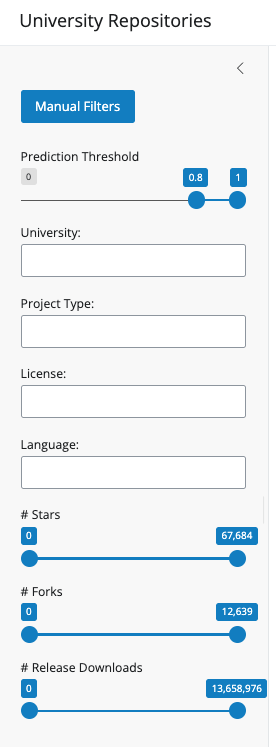
Everything in the main views responds to the same filter set (unless noted). On the left you’ll find:
- Prediction threshold: Keeps repositories whose estimated affiliation probability falls in the range you choose (for example, high-confidence matches only). The default value for this metric is 0.8.
- University: One or more institutions to include.
- Project type: Filter by the predicted project type from the model.
- License: Filter by declared license.
- Language: Filter by primary programming language.
- # Stars / # Forks / # Release downloads: Sliders to restrict repositories by those numeric ranges.
Use Reset all filters to clear selections and ranges and start over.
Main tabs: what you’ll see
Overview
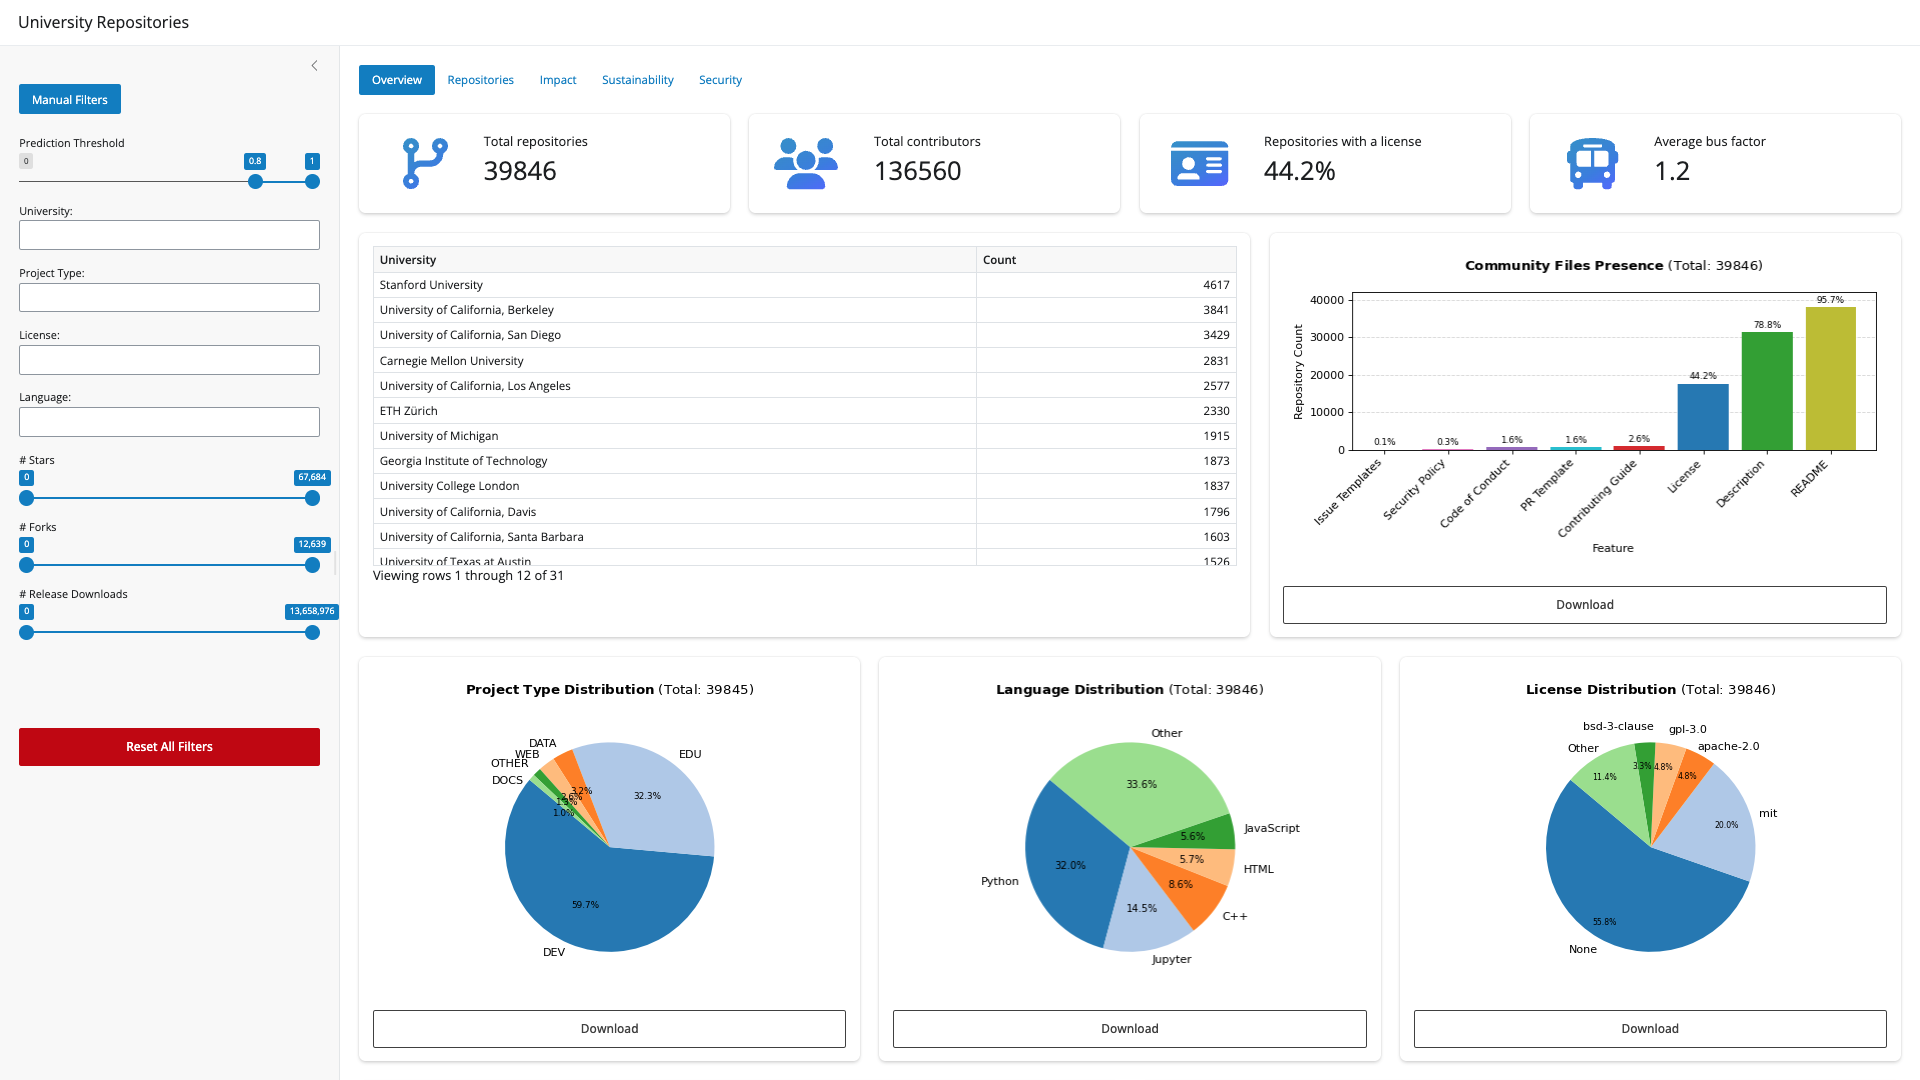
High-level summary numbers: how many repositories and contributors are in view, what share has a license, and average bus factor (a simple resilience signal). Below that:
A table of repository counts per university; charts for community files (README, contributing guide, security policy, etc.); and project type, language, and license distributions, including breakdowns by project type where it helps compare segments.
This tab is a good first stop for “what’s in the box?” after you set filters.
Repositories
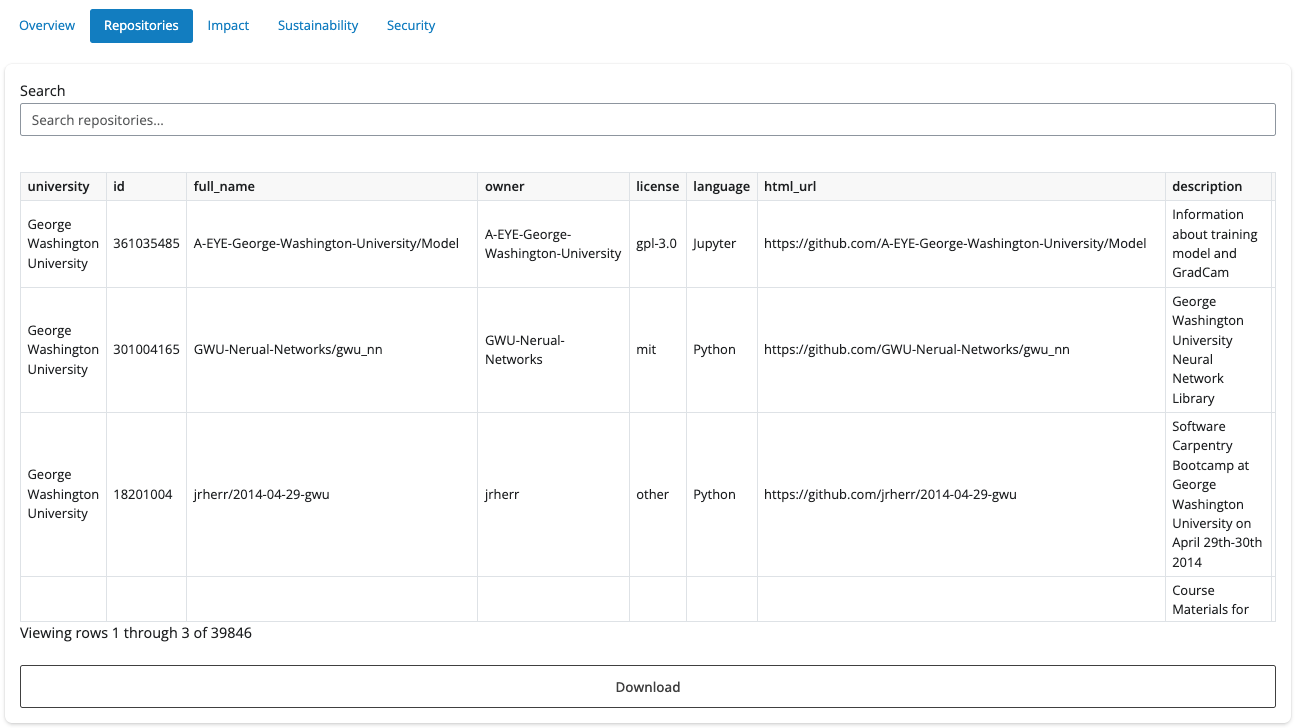
A searchable table of repositories matching your filters. Click a row to open a detail panel:
- Overview: name, university, license, language, type, description, and link to GitHub
- Impact: stars, forks, release downloads, issues, and contributors
- Health: quick checks for description, README, contributing guide, code of conduct, security policy, and issue/PR templates
- Security: OpenSSF Scorecard metrics when available for that repo.
Alongside that, tabs show the README, Contributing guide, and Security policy as rendered markdown when present. You can download the filtered repository list as CSV from this area.
Impact
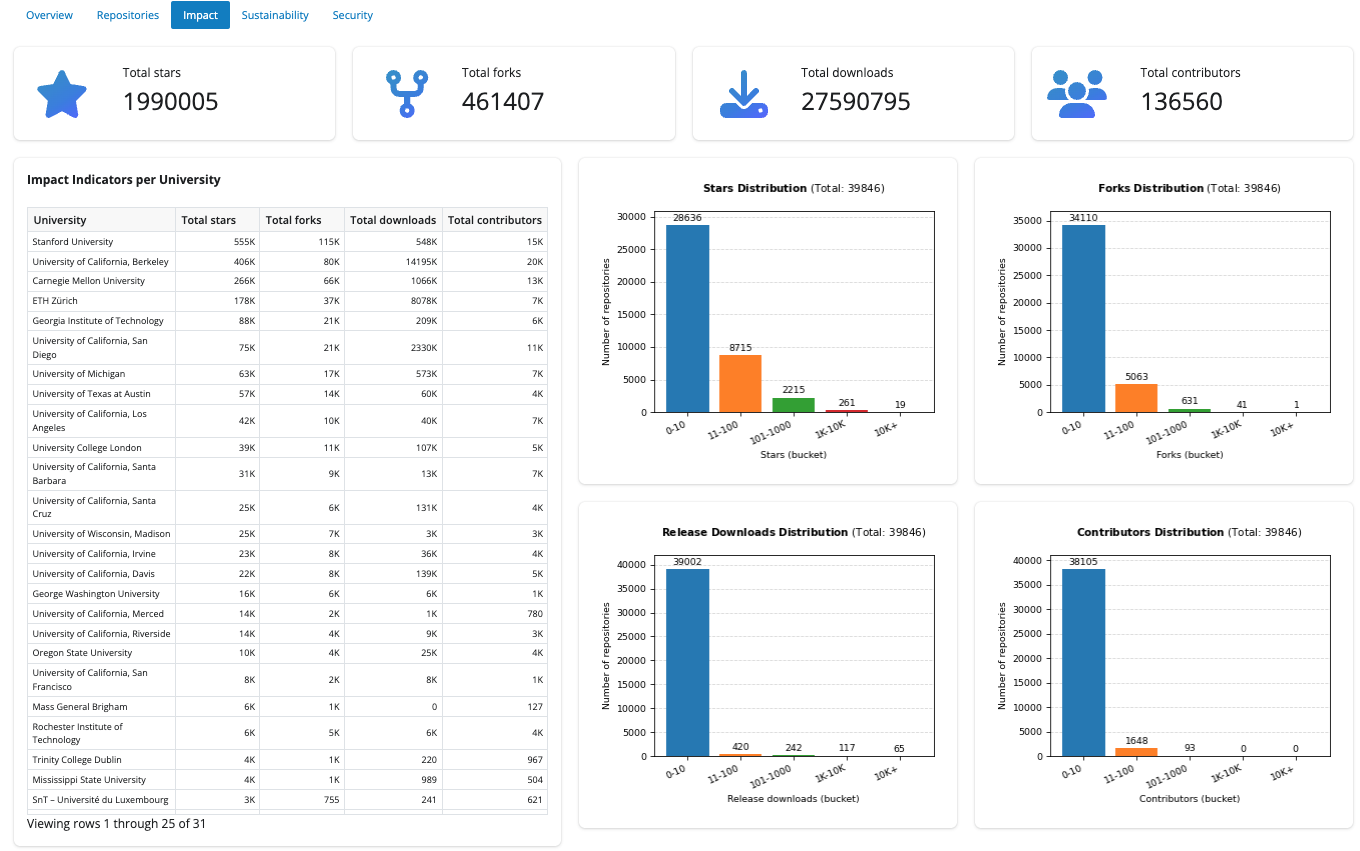
Totals across the filtered set for stars, forks, release downloads, and contributors. An Impact indicators per university table ranks institutions by those measures. Distribution charts show how stars, forks, downloads, and contributors spread across buckets.
Sustainability
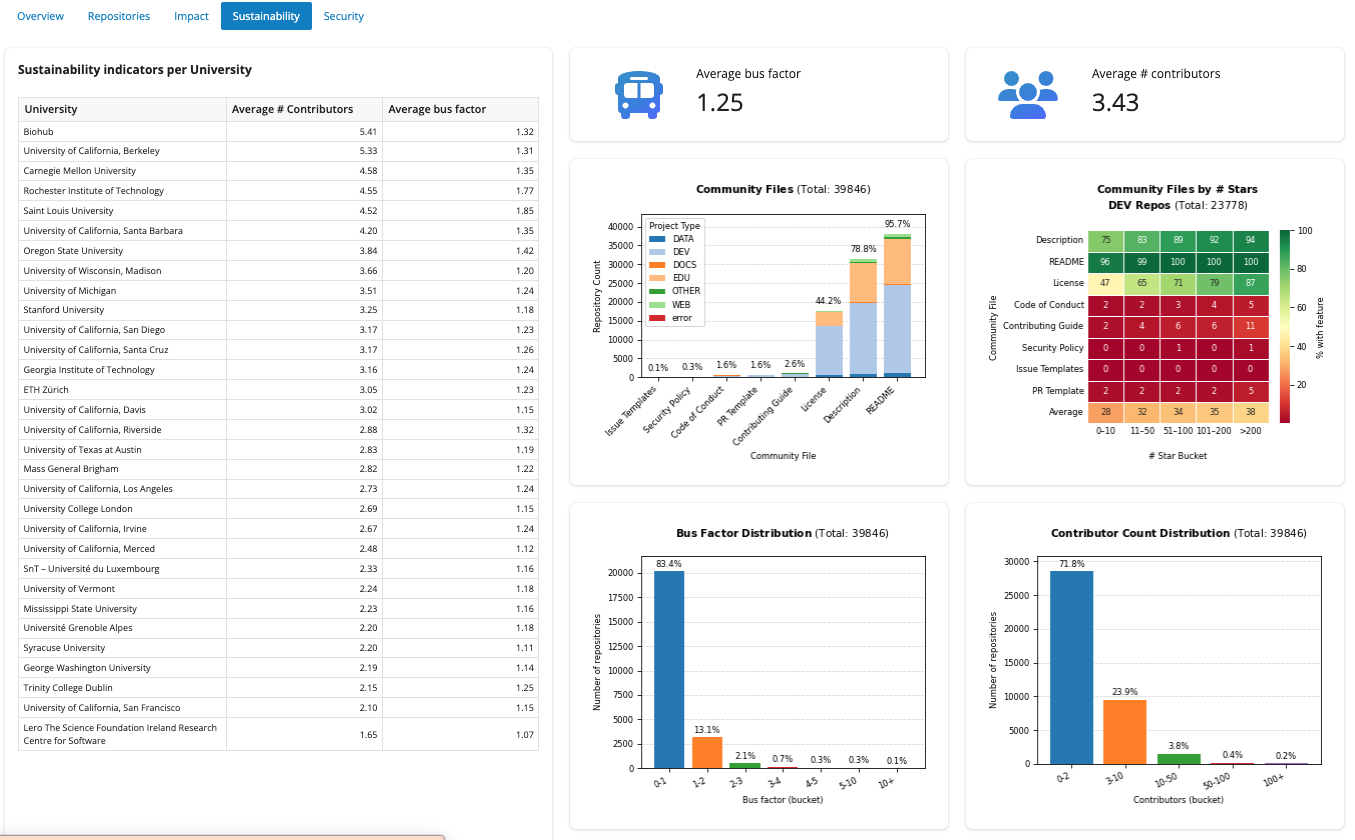
Focuses on maintainability-style signals: average contributors and average bus factor per university in a leaderboard table, plus summary value boxes. Charts include community feature presence by project type, a heatmap of features for development (DEV)-typed repos across star ranges, and distributions of bus factor and contributor count buckets.
Security
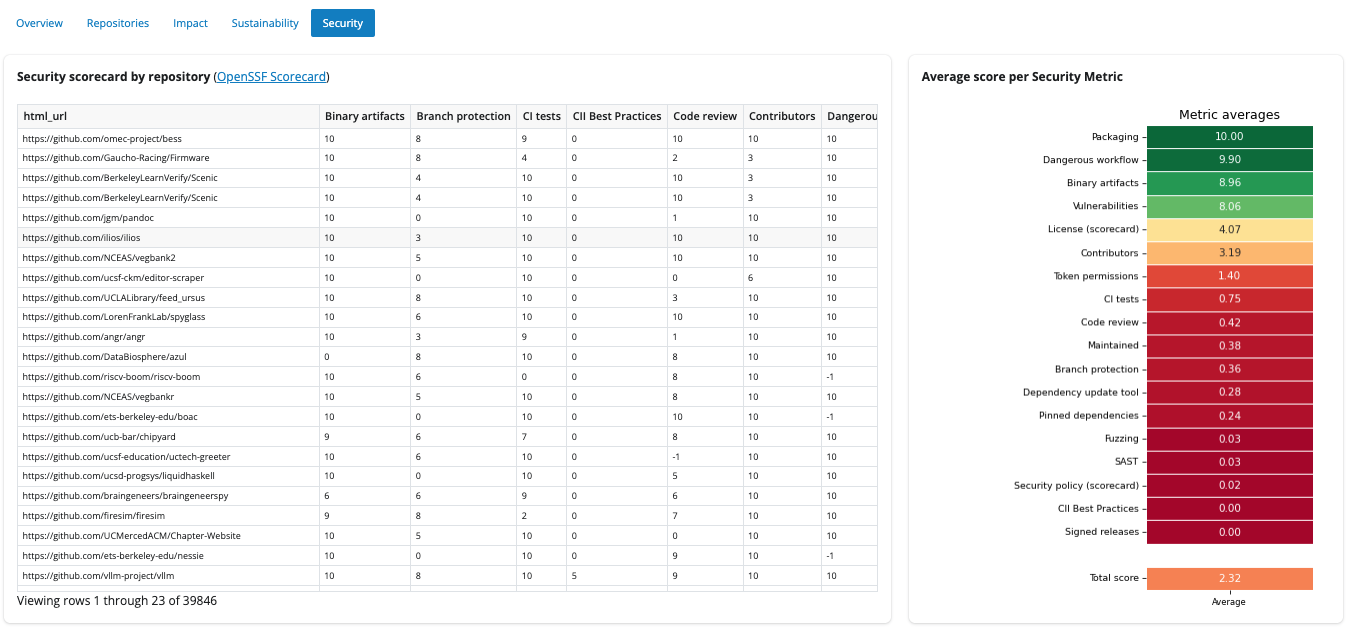
Two complementary views:
- A wide table of repositories with OpenSSF Scorecard columns (scores align with scorecard.dev).
- An average score per metric visualization so you can see which security checks tend to score higher or lower across the filtered repositories.
Remember: many cells may be empty until scorecard coverage catches up with the full repository list.
A quick note on limitations
- Affiliation and type come from models and heuristics, so they can be wrong or outdated.
- GitHub metadata changes, so some numbers might be outdated. (I plan to figure out how to do periodic scraping) Scorecard results are partial today but are intended to grow toward full coverage.
For comments or feedback please open an issue: https://github.com/juanis2112/repoexplorer